Discrete Fourier Transform#
import numpy as np
import scipy.linalg as la
import matplotlib.pyplot as plt
from IPython.display import Audio
plt.rcParams["figure.figsize"]=(15,4) # Set default figure size
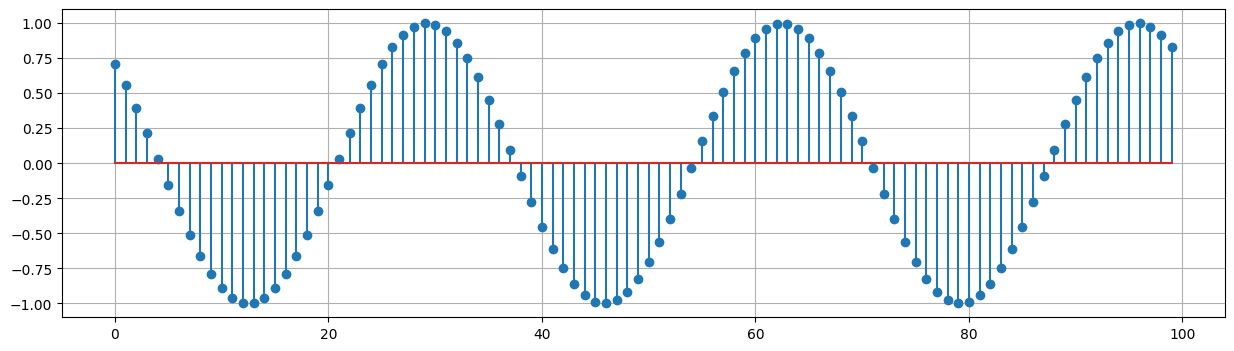
Examples of sinusoids#
N = 100
k = 3
n = np.arange(0,N)
phi = np.pi/4
x = np.cos(2*np.pi*k*n/N + phi)
plt.stem(x,use_line_collection=True)
plt.grid(True); plt.show();
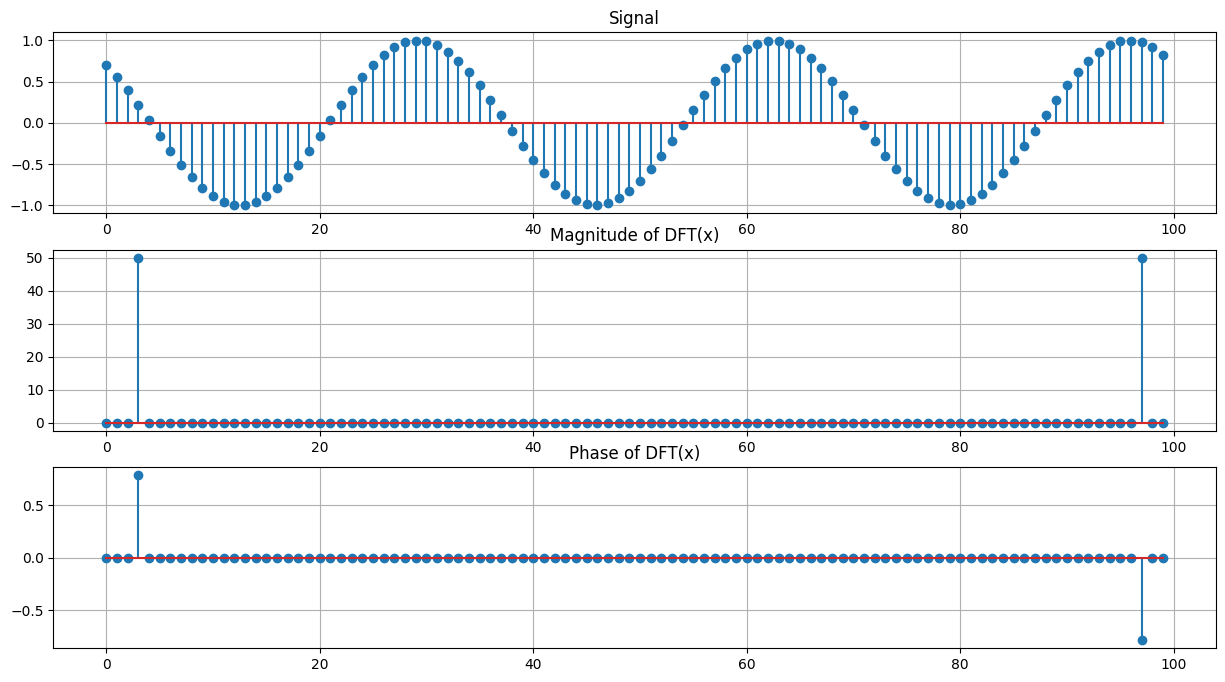
Compute FFT#
N = 100
k = 3
n = np.arange(0,N)
phi = np.pi/4
x = np.cos(2*np.pi*k*n/N + phi)
y = np.fft.fft(x)

plt.figure(figsize=(15,8))
plt.subplot(3,1,1)
plt.stem(x,use_line_collection=True)
plt.title('Signal'); plt.grid(True);

plt.subplot(3,1,2)
plt.stem(np.abs(y),use_line_collection=True)
plt.title('Magnitude of DFT(x)'); plt.grid(True);

plt.subplot(3,1,3)
y_angle = np.angle(y)
y_angle[np.abs(y) < 1e-12] = 0
plt.stem(y_angle,use_line_collection=True)
plt.title('Phase of DFT(x)'); plt.grid(True)

plt.show();
Play audio signal#
N = 44100
k1 = 500; k2 = 750; k3 = 1100;
n = np.arange(0,N)
x = sum([np.cos(2*np.pi*k*n/N) for k in [k1,k2,k3]])
Audio(x,rate=N)
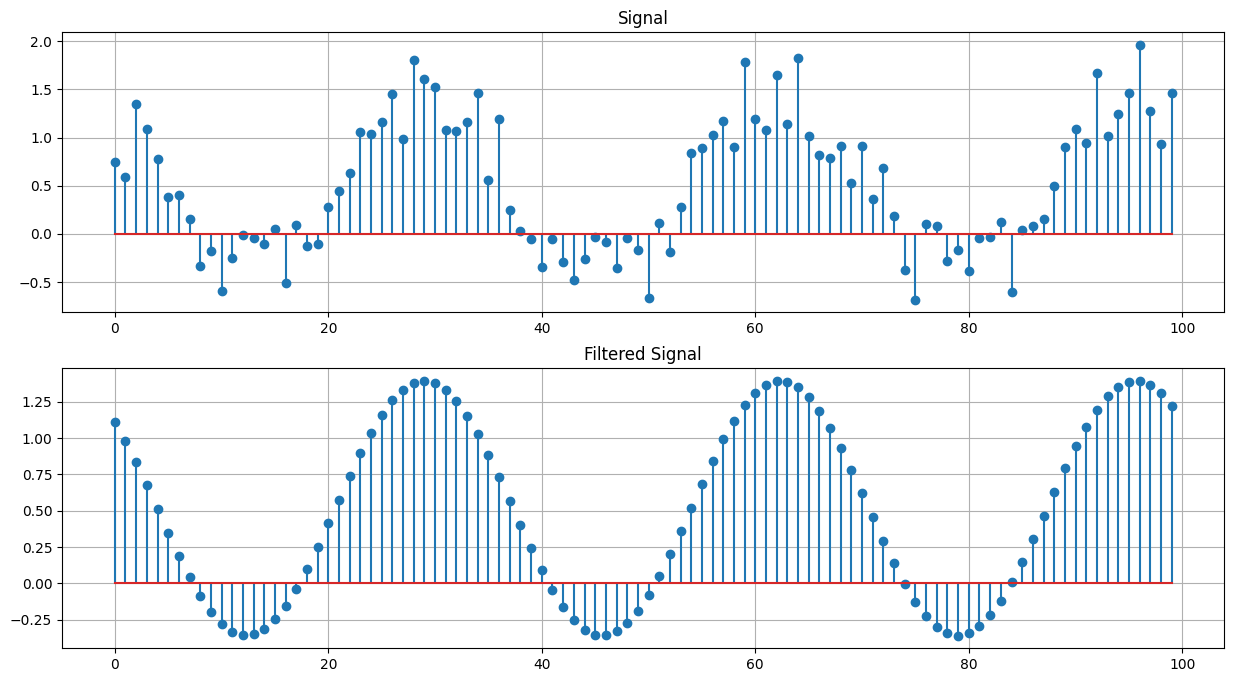
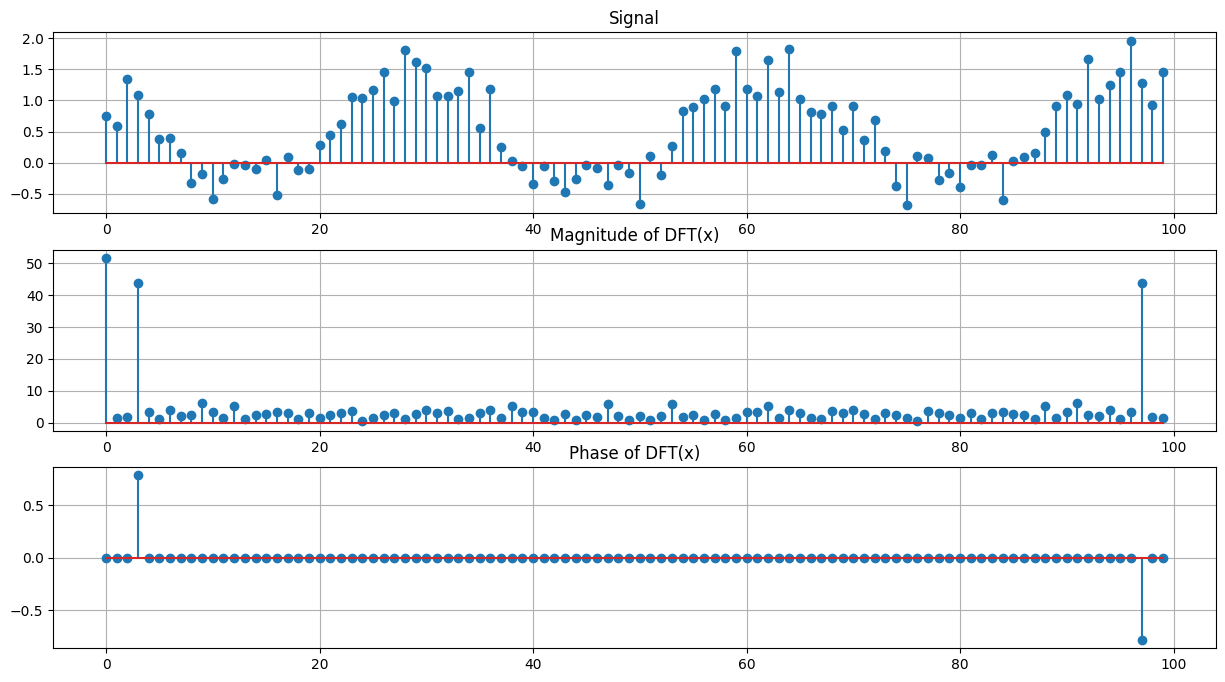
Filtering#
N = 100
k = 3
n = np.arange(0,N)
phi = np.pi/4
x = np.cos(2*np.pi*k*n/N + phi) + np.random.random(N)
y = np.fft.fft(x)

plt.figure(figsize=(15,8))
plt.subplot(3,1,1)
plt.stem(x,use_line_collection=True)
plt.title('Signal'); plt.grid(True);

plt.subplot(3,1,2)
plt.stem(np.abs(y),use_line_collection=True)
plt.title('Magnitude of DFT(x)'); plt.grid(True);

plt.subplot(3,1,3)
plt.stem(y_angle,use_line_collection=True)
plt.title('Phase of DFT(x)'); plt.grid(True)

plt.show();
y_filtered = y.copy()
y_filtered[y < 10] = 0.0
plt.figure(figsize=(15,8))
x_filtered = np.fft.ifft(y_filtered).real

plt.subplot(2,1,1)
plt.stem(x,use_line_collection=True)
plt.title('Signal'); plt.grid(True);

plt.subplot(2,1,2)
plt.stem(x_filtered,use_line_collection=True)
plt.title('Filtered Signal'); plt.grid(True);

plt.show();